A Very Basic Propagation Primer
by John Shannon, K3WWP

The most important body in the solar system to amateur radio operators is the sun. The number of disturbances on the sun (sunspots) directly affects how successful we are on the bands. The more sunspots there are, the more radiation the sun emits. In turn, the more radiation that hits the earth, the more active the ionosphere becomes. An active ionosphere means conditions improve on the higher HF ham bands.
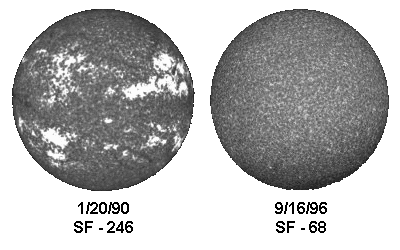
Sunspots come and go in roughly 11 year cycles, going from a spotless sun at minimum to one covered with spots at a maximum. The picture above shows the different appearance of the sun near a maximum (left) and minimum (right). The date and Solar Flux for that date are at the bottom of each photo. The pictures are from The National Solar Observatory at Sacramento Peak. The pictures were taken through a special filter to show the sun's surface more clearly.
Near the maximum of a sunspot cycle (2012 or 2014 for the dual peak of cycle 24) the higher bands (10, 12, 15, 17 meters) are full of DX stations. Often the bands are open for DX work around the clock. When the sunspots are at a minimum (2009/2010 as cycle 23 ended and cycle 24 began), the higher bands from 17 through 10M may be completely devoid of signals for days or weeks at a time.
There are also other features on the sun that affect our ionosphere such as coronal holes, solar flares, etc. Discussion of those features is beyond the scope of this explanation.
Three of the values that are used to measure propagation conditions are Solar Flux and the A & K indices. Solar flux is a measure of the sun's radiation. It varies fairly directly with the number of sunspots, ranging from a minimum in the low 60's to a maximum over 400. I have a file of daily SF values going back to 1947. The highest SF in that file is 457 on Apr 7, 1947 - the lowest 63 on Nov 3, 1954 and 2 earlier dates. The A index measures the geomagnetic activity in the earth's magnetic field. Low geomagnetic activity allows our signals to pass more freely through the ionosphere. The A index varies in a range of 0 to 400. The A index is derived from the K index which is a short term value of geomagnetic activity. It ranges from 0 to 9 and is measured several times daily. Those values are combined over 24 hours by a special formula to give the A index. Ideally, we look for high SF values combined with low A and K index values to give us the best propagation.
The sun rotates on its axis in around 28 days (faster at its equator and slower at its poles). The table on my main Propagation page shows solar flux values (SF) and A indices (A) in columns that are approximately one solar rotation (28 days) long. Therefore, if there is a period of good (or bad) conditions in one column, it is likely to recur near the same position in the next column to the right. Thus predictions can be made from the table. However, caution must be used in making predictions, because features constantly come and go on the sun. Some features can exist for several solar rotations causing similar conditions every 28 days or so, while other features are short-lived, lasting for less than a full solar rotation.
I have tried to keep my explanation as brief and simple as possible. The study of radio propagation is a science to itself, and there has been much written about it. If this bit of information has whetted your appetite for more knowledge of propagation, check out my many propagation links.


